Port Everglades logo
About Us
Directory
Governing Board
History
Location
Port Administration
Security
Visitor Access
ID Badges
Media Access
Ship Schedule
Sister Seaports
Statistics
Tariff
Water Quality
Weather Alerts
News Room
Film Guide
Helpful Resources
Media Guide
Photo Gallery
Port Publications
Download Photos
Press Releases
Sitemap
Video Gallery
Statistics
Tides & Currents
App
Cruise
Airport
Arriving/Departing
Cruise FAQs
Cruise Guide
Cruise Lines
Cruise Terminals
Terminal 2
Terminal 4
Terminal 18
Terminal 19
Terminal 21
Terminal 25
Terminal 26
Terminal 29
Parking
Parking Fees
Disabled Parking
Security
Ship Schedule
Shore Excursions
Tariff
Transportation
Cargo
Bulk/Break Bulk
Containerized Cargo
Cranes & Services
Facilities
Near-Dock Rail
Perishables
Petroleum
From Tanker to Gas Tank
Petroleum Companies
Petroleum Facts & Statistics
Tariff
Shipping Lines
Tariff
Terminal Operators
Transit Times
Trucker Traffic Cam
Business
Annual Report
Business Forms
County Jobs
Directory
FTZ No. 25
FTZ Annual Statistics
Master Plan
Meetings & Workshops
Opportunities
Real Estate
Tariff
Development
Convention Center Expansion
Harbor Deepening & Widening
marine infrastructure program
Crane Improvements
slip 1
Southport Turning Notch Extension
terminal 2, 4
International Logistics Center
Master/Vision Plan
Master Plan Reports
Master Plan Team
Deepening & Widening
Presentations
Technical Reports
Workshops
Investment
Bond Information
Budget
Business Information
Contacts
Financial Reports
Tariff
Stewardship
Economic Impact
Environment
Air Quality
Coral Reefs
Partnerships
Sustainable Facilities
Water
Wetlands
Wildlife
Helpful Resources
Meetings & Workshops
Navy & Coast Guard
Outreach
Public Art
Water Quality Update
Port Everglades logo
App

statistics

Waterborne Commerce Chart FY 2021-2012 (PDF 63 kb)
10-year statistics for all revenue-generating waterborne commerce at Port Everglades including:

  • passenger counts
  • tonnage
  • TEUs (twenty-foot equivalent units)
  • barrels of petroleum

Annual Commerce Report 
The Annual Commerce Report provides statistics, financial statements and historical information about Port Everglades during Broward County's fiscal year (October 1 through September 30).

Cruise Passenger Survey FY2014/2015 (PDF 1.9 mb)
During the 2014/2015 cruise season, Port Everglades conducted a Cruise Survey to collect cruise passenger data for marketing and economic impact analyses purposes. Data points ranged from age and gender to trip origin and expenditures pre/post cruise, from transportation choice to means of booking and cruising frequency.

Economic Impact FY2021 Report 
Port Everglades generates more than $30 billion worth of business activity annually and supports 7,013 direct local jobs and 206,255 jobs statewide, according to a study produced by nationally recognized maritime research company Martin Associates.  

Foreign-Trade Zone No.25 Annual Statistics

Monthly TEUs Loaded Report (69 kb)
Fiscal Year 2023

Port Everglades Trade Data  - Port Everglades offers the latest U.S. Census Bureau trade data courtesy of World City, which is updated monthly. The data includes the percentage of trade by country, by exports and imports, with the ability to shift between the current month, year to date, the latest annual data, by dollar value and tonnage as well as national ranking, compared to all U.S. trade gateways within your specific transportation mode – ocean; includes an analysis of the changes among the top five trade partners, exports and imports. 
annual commerce report statistics fy2021

FY 2021 Top 10 Containerized Commodities in TEUs, Short Tons and Value
(all dollar values are estimates provided by PIERS)

RANK  COMMODITY  TEUs  TONS  VALUE 
1 Apparel 50,368 382,116 $6,654,424,775
2 Beverages 32,407 392,164 $682,3523,720
3 Machinery 31,704 533,586 $6,861,750,635
4  Motor Vehicles 29,741 176,842 $1,476,711,047
5 Other Food Products 26,991 249,81 $1,279,009,390
6 Industrial Chemicals 21,709 303,607 $1,558,392,722
7 Steel Products 20,562 498,026 $1,296,444,450
8 Furniture 19,948 126,128 $697,852,712
9 Textiles 19,472 233,194 $1,096,613,330
10 Paper 17,366 179,471 $422,481,740

Source: PIERS


FY 2021 Top 10 Exported Containerized Commodities in TEUs, Short Tons and Value
(all dollar values are estimates provided by PIERS)

 RANK COMMODITY TEUs TONS  VALUE 
1 Motor Vehicles 28,941 155,539 $1,282,723,515
2 Apparel 24,333 213,702 $4,820,661,154
3 Machinery 23,748 178,208 $5,055,250,476
4 Other Food Products * 20,524 199,278 $1,095,802,019
5 Industrial Chemicals 15,786 140,781 $658,172,109
6 Furniture 15,170 103,651 $635,845,839
7 Steel Products 14,645 107,647 $917,943,743
8 Textiles 13,522 190,032 $949,488,077
9 Beverages 10,747 119,596 $174,704,280
10 Medical 9,759 70,285 $4,187,082,334

Source: PIERS
(*) "All Others" includes perishables and refrigerated cargo

FY 2021 Top 10 Imported Containerized Commodities in TEUs, Short Tons and Value
(all dollar values are estimates provided by PIERS)

 RANK COMMODITY TEUs TONS  VALUE 
1 Apparel 26,018 168,413 $1,833,763,621
2 Beverages 21,649 272,568 $507,819,440
3 Panel Products 11,852 172,479 $91,170,271
4 Aluminum & Non Ferrous 9,653 133,172 $215,096,362
5 Paper 9,265 98,391 $146,946,794
6 Fruits and Vegetables 8,050 84,349 $111,135,574
7 Machinery 7,864 355,378 $1,806,500,159
8 Lumber 6,858 81,094 $93,814,635
9 Glass/Ceramic 6,795 142,489 $101,655,438
10 Other Food Products 6,434 49,803 $183,207,371

Source: PIERS

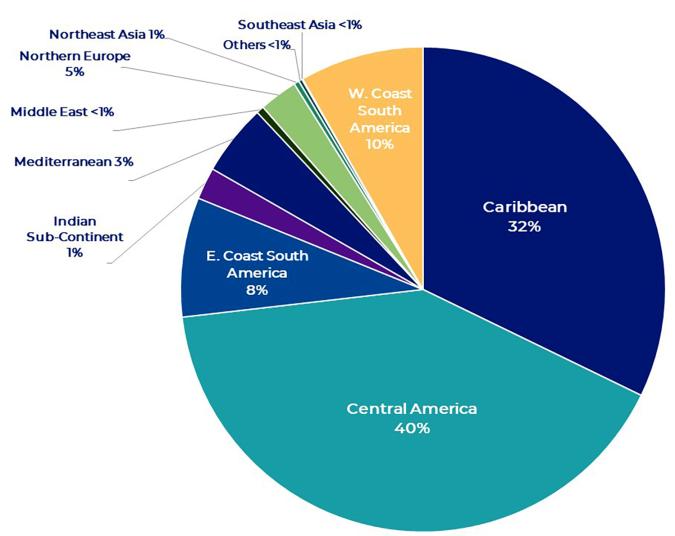
FY2021 Containerized Cargo by Tradelane
Source: Port Everglades

Tradelanes for FY 2021

FY2021 Containerized Cargo Performance in Key Markets 
In TEUs

Source: PIERS

Total Traffic TEUs   US PORT            
Trade Lane Port Everglades W Palm Beach  Jaxport  Miami  Charleston  Savannah  Total 
Caribbean 207,221    150,696 37,321 157,239 8,372 36,758 597,608
Central America 269,469 711 19,226 167,349 35,518 90,591 582,904
E. Coast South America 58,417 1,963 52,223 931 64,735 36,755 215,024
Indian Sub-Continent   186 - 5,335 6,833 107,502 214,062 333,917
Mediterranean 1,401 6 440 127,826 99,204 355,227 584,104
Middle East 5,099 - 3,250 6,657 36,224 169,382 220,611
Northern Europe 39,045 - 3,390 35,688 484,254 360,24 922,618
Northeast Asia 128 - 142,278 143,230 528,936 1,662,779 2,477,351
Others 1,643 9,414 478,517 2,826 66,889 60,628 619,917
Southeast Asia 28 - 54,336 66,215 266,070 477,537 864,185
W. Coast South America 62,589 - 471 51,088 47,686 58,180 220,015
Grand total 645,226 162,791 796,827 765,881 1,745,390 3,522,139 7,638,254
% of TOTAL CARGO 8% 2% 10% 10% 23% 46% 100%*

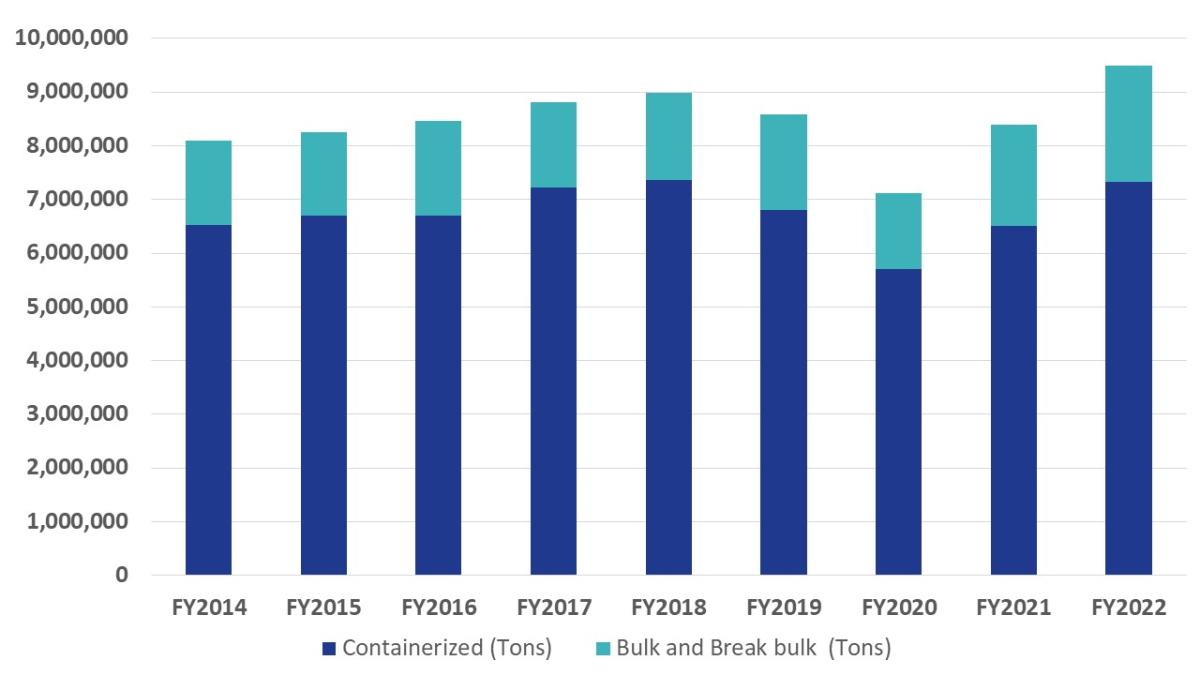
FY2020 Historical Cargo Tonnage Activity
Containerized, Bulk, Break Bulk
Fiscal Years 2011 - 2020 
Source: Port Everglades

Historical Container Activity at Port Everglades for FY2020


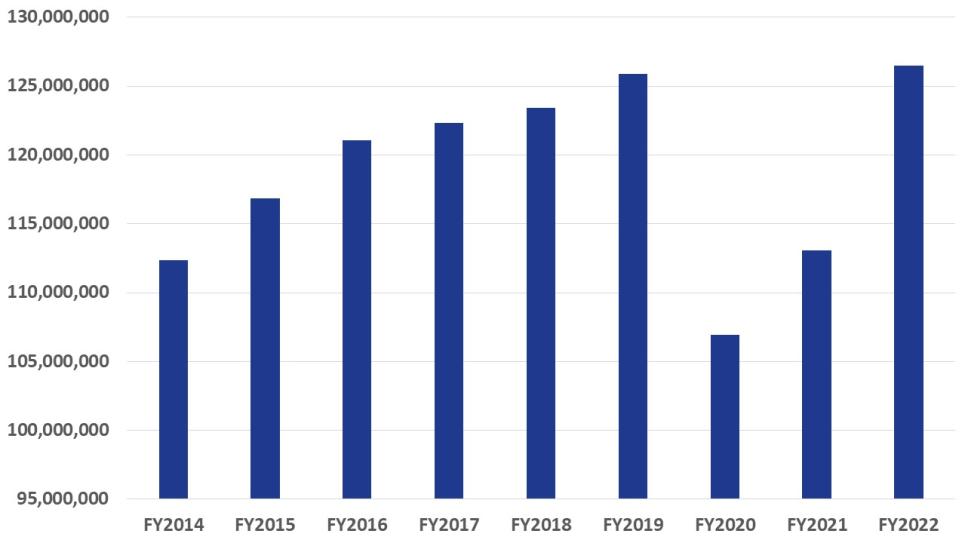
Annual Petroleum Throughput
Source: Port Everglades

  FY2020 FY2019 FY2018 FY2017 FY2016
Barrels 106,919,139 125,874,463 123,404,236 122,307,652 122,680,234
Total Tons 15,147,573 17,769,697 17,433,963 17,260304 17,095,585


FY2020 Historical Petroleum Activity
Fiscal Years 2020 - 2011
Source: Port Everglades

Historical Petroleum Activity for FY2020


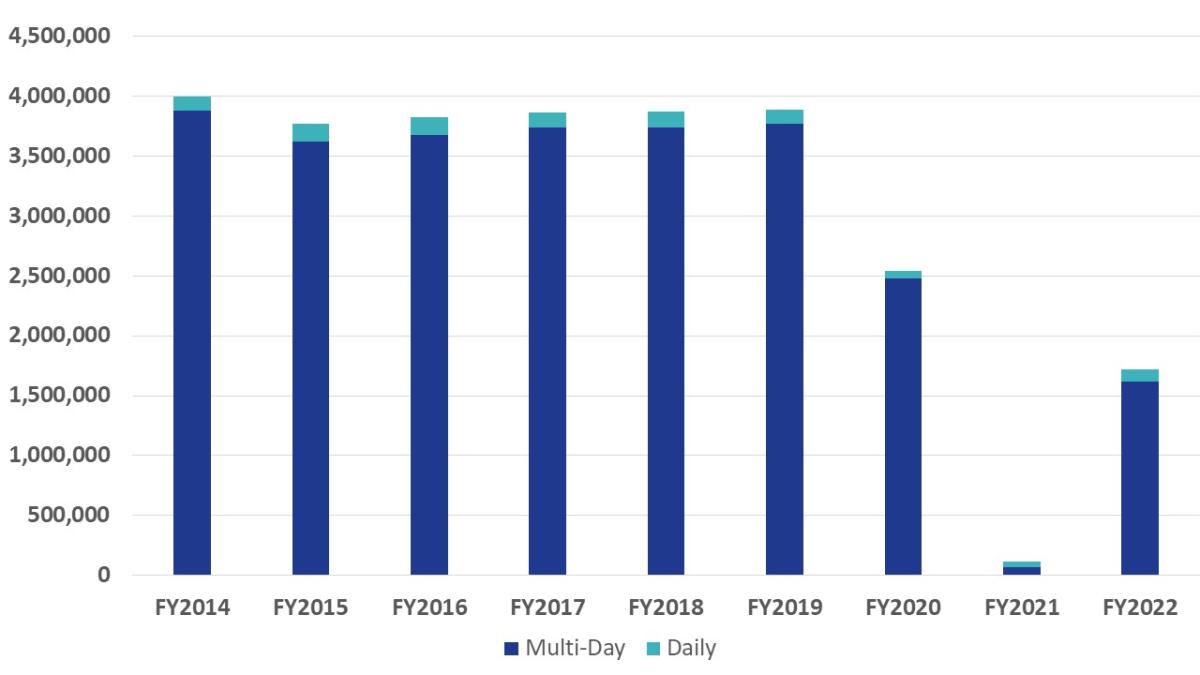
FY2020 Historical Cruise Passenger Activity
Fiscal Years 2011 - 2020
Source: Port Everglades

Cruise Activity for FY2020

Statistics

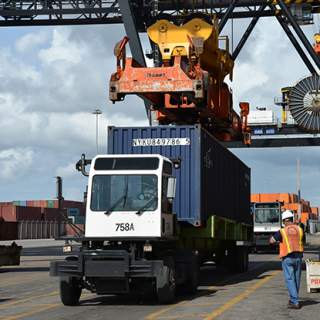
Gantry Crane Unload Containers Dockside

Port Tariff

Port Everglades Harbormaster Tower

Ship Schedule

Port Everglades

Port Everglades Department
1850 Eller Drive
Fort Lauderdale, FL  33316
954-523-3404

CruiseSchedule Port Everglades

This app is available only on the App Store for iPhone and iPad.

  • Contact Us
  • Privacy Policy