Statistics
Waterborne Commerce Chart FY 2023-2014 (PDF 641kb) - 10-year statistics for all revenue-generating waterborne commerce at Port Everglades including:
- passenger counts
- tonnage
- TEUs (twenty-foot equivalent units)
- barrels of petroleum
Economic Impact FY2023 Report (PDF 458kb)
Port Everglades generates more than $26.5 billion worth of business activity annually and supports 10,778 direct local jobs and 192,688 jobs statewide, according to a study produced by nationally recognized maritime research company Martin Associates.
Cruise Passenger Survey 2022/2023 (PDF 7mb)
Port Everglades conducted a Cruise Survey to collect cruise passenger data for marketing and economic impact analyses purposes. Data points ranged from age and gender to trip origin and expenditures pre/post cruise, from transportation choice to means of booking and cruising frequency.
Foreign-Trade Zone No.25 Annual Statistics
Monthly TEUs Loaded Report (84kb)
March 2024 (Fiscal Year 2024)
Port Everglades Trade Data - Port Everglades offers the latest U.S. Census Bureau trade data courtesy of World City, which is updated monthly. The data includes the percentage of trade by country, by exports and imports, with the ability to shift between the current month, year to date, the latest annual data, by dollar value and tonnage as well as national ranking, compared to all U.S. trade gateways within your specific transportation mode – ocean; includes an analysis of the changes among the top five trade partners, exports and imports.
Annual Commerce Report Statistics FY2023
FY 2023 Top 10 Containerized Commodities in TEUs, Short Tons and Value
(all dollar values are estimates provided by PIERS)
| RANK | COMMODITY | TEUs | TONS | VALUE |
| 1 | Apparel | 42,526 | 302,592 | $6,648,294,447 |
| 2 | Steel Products | 39,898 | 544,669 | $3,165,865,419 |
| 3 | Machinery | 38,909 | 565,186 | $6,610,619,900 |
| 4 | Furniture | 38,162 | 265,774 | $1,432,396,163 |
| 5 | Beverages | 32,694 | 421,570 | $721,780,040 |
| 6 | Motor Vehicles | 29,516 | 135,798 | $1,760,404,948 |
| 7 | Other Food Products | 28,285 | 244,089 | $1,315,576,212 |
| 8 | Aluminum & Non Ferrous | 21,719 | 277,721 | $777,686,559 |
| 9 | Industrial Chemicals | 21,355 | 244,517 | $3,872,812,950 |
| 10 | Textiles | 16,756 | 129,663 | $519,949,544 |
Source: PIERS
FY 2023 Top 10 Exported Containerized Commodities in TEUs, Short Tons and Value
(all dollar values are estimates provided by PIERS)
| RANK | COMMODITY | TEUs | TONS | VALUE |
| 1 | Furniture | 28,704 | 214,275 | $1,287,092,337 |
| 2 | Machinery | 28,477 | 159,085 | $4,397,587,418 |
| 3 | Steel Products | 28,098 | 219,212 | $2,747,298,507 |
| 4 | Motor Vehicles | 27,118 | 115,897 | $1,494,645,424 |
| 5 | Other Food Products | 19,885 | 179,726 | $1,037,601,263 |
| 6 | Industrial Chemicals | 15,508 | 132,438 | $659,860,627 |
| 7 | Apparel | 15,067 | 135,401 | $2,541,743,393 |
| 8 | Vehicle Parts | 9,747 | 62,998 | $545,667,280 |
| 9 | Textiles | 9,501 | 77,858 | $349,987,848 |
| 10 | Beverages | 8,090 | 87,503 | $144,308,127 |
Source: PIERS
FY 2023 Top 10 Imported Containerized Commodities in TEUs, Short Tons and Value
(all dollar values are estimates provided by PIERS)
| RANK | COMMODITY | TEUs | TONS | VALUE |
| 1 | Apparel | 27,458 | 167,191 | $4,106,551,054 |
| 2 | Beverages | 24,603 | 334,066 | $577,471,913 |
| 3 | Aluminum & Non Ferrous | 16,447 | 245,462 | $541,975,478 |
| 4 | Steel Products | 11,800 | 325,457 | $418,566,912 |
| 5 | Machinery | 10,431 | 406,100 | $2,213,032,482 |
| 6 | Aggregates | 10,221 | 264,543 | $206,515,632 |
| 7 | Other Manufactured Plastics | 10,130 | 78,045 | $280,659,627 |
| 8 | Furniture | 9,458 | 51,498 | $145,303,826 |
| 9 | Glass/Ceramic | 9,088 | 193,281 | $195,034,068 |
| 10 | Other Food Products | 8,400 | 64,363 | $277,974,949 |
Source: PIERS
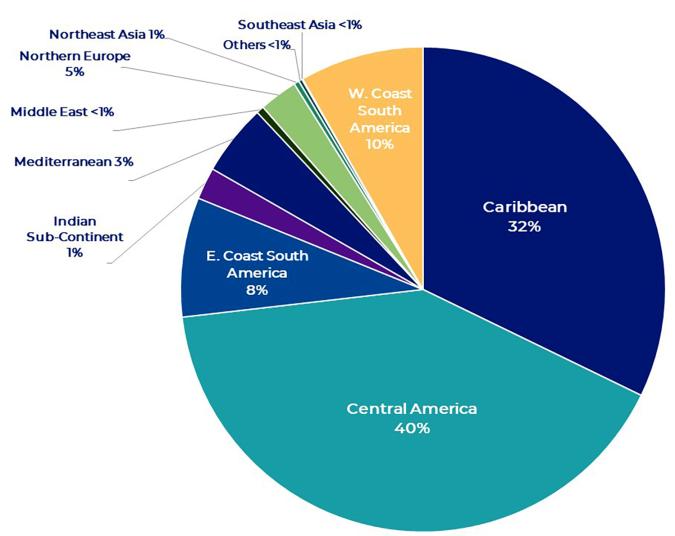
FY2023 Containerized Cargo by Tradelane
Source: Port Everglades
FY2023 Containerized Cargo Performance in Key Markets
In TEUs
Source: PIERS
| Total Traffic TEUs | US PORT | ||||||
| Trade Lane | Port Everglades | W Palm Beach | Jaxport | Miami | Charleston | Savannah | Total |
| Caribbean | 211,594 | 147,428 | 33,602 | 149,698 | 12,115 | 50,521 | 604,688 |
| Central America | 257,775 | 1,416 | 32,916 | 192,753 | 51,691 | 89,166 | 625,718 |
| E. Coast South America | 54,341 | - | 51,706 | 42 | 62,692 | 43,923 | 211,714 |
| Indian Sub-Continent | 4,147 | - | 7,303 | 13.114 | 128,635 | 323,445 | 476,643 |
| Mediterranean | 21,890 | 7 | 1,948 | 121.173 | 101,935 | 388,331 | 635,284 |
| Middle East | 1,821 | - | 11,421 | 5,071 | 29,769 | 167,451 | 215,533 |
| Northern Europe | 29,648 | 6 | 9,885 | 42,686 | 486,877 | 316,323 | 885,425 |
| Northeast Asia | 8,679 | 5 | 87,475 | 138,899 | 591,656 | 1,657,585 | 2,484,298 |
| Others | 1,106 | 12157 | 515,756 | 2,122 | 63,636 | 63,279 | 656,056 |
| Southeast Asia | 529 | 4 | 63,069 | 70,881 | 277,263 | 530,331 | 942,076 |
| W. Coast South America | 62,501 | - | 242 | 73,307 | 40.961 | 42,296 | 219,306 |
| Grand total | 654,031 | 161,023 | 813,321 | 809,745 | 1,847,230 | 3,672,381 | 7,957,732 |
| % of TOTAL CARGO | 8% | 2% | 10% | 10% | 23% | 46% | 100%* |
FY2022 Historical Cargo Tonnage Activity
Containerized, Bulk, Break Bulk
Fiscal Years 2014 - 2022
Source: Port Everglades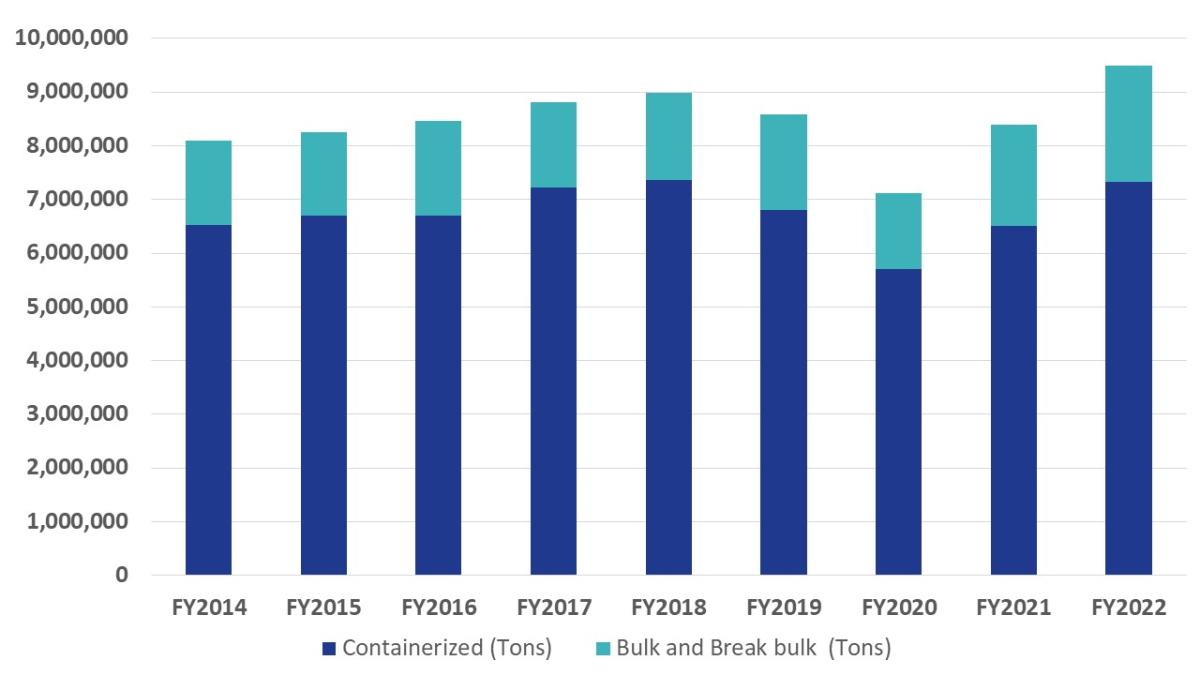
Energy by Products
FY2022 vs FY2021 (Barrels)
Source: Port Everglades
|
PRODUCT |
FY2022 | FY2021 | % Change |
|---|---|---|---|
| Asphalt | 463,183 | 408,881 | 13$ |
| Aviation Gasoline | 193,689 | 195,854 | -1% |
| Crude Oil Loaded | - | 179,723 | -100% |
| Diesel Fuel | 18,186,799 | 16,754,363 | 9% |
| Ethanol | 1,614,386 | 1,010,075 | 60% |
| Fuel Oil | 2,177,352 | 355,117 | 496% |
| Gasoline | 62,863,059 | 60,667,675 | 4% |
| Jet Fuel | 35,078,708 | 27,198,145 | 29% |
| Propane | 531,444 | 399,570 | 33% |
| Truck & Rail - Ethanol | 5,449890 | 5,865,593 | -7% |
| Truck & Rail - Other | 3,955 | 10,817 | -63% |
| Total Barrels | 126,502,464 | 113,045,814 | 12 % |
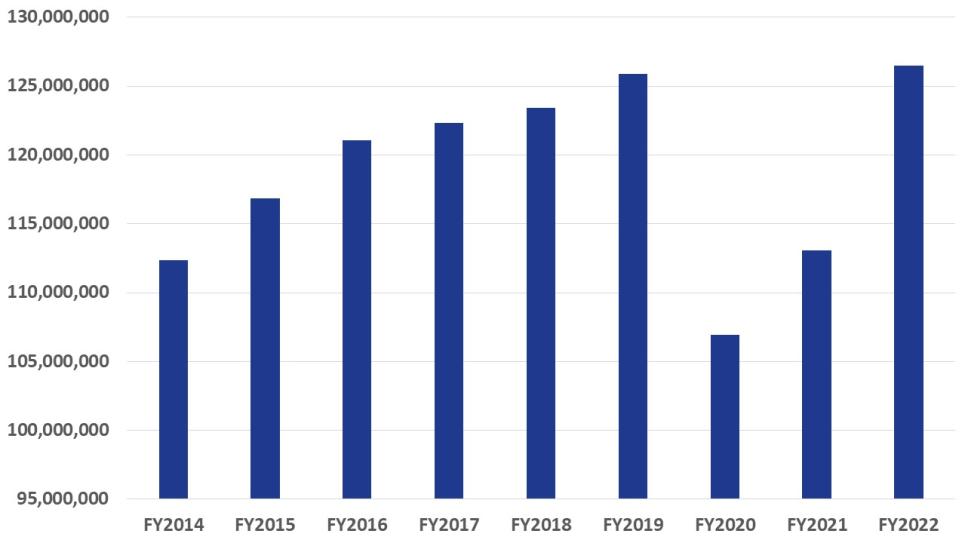
FY2022 Historical Petroleum Activity
Fiscal Years 2014 - 2022
Source: Port Everglades
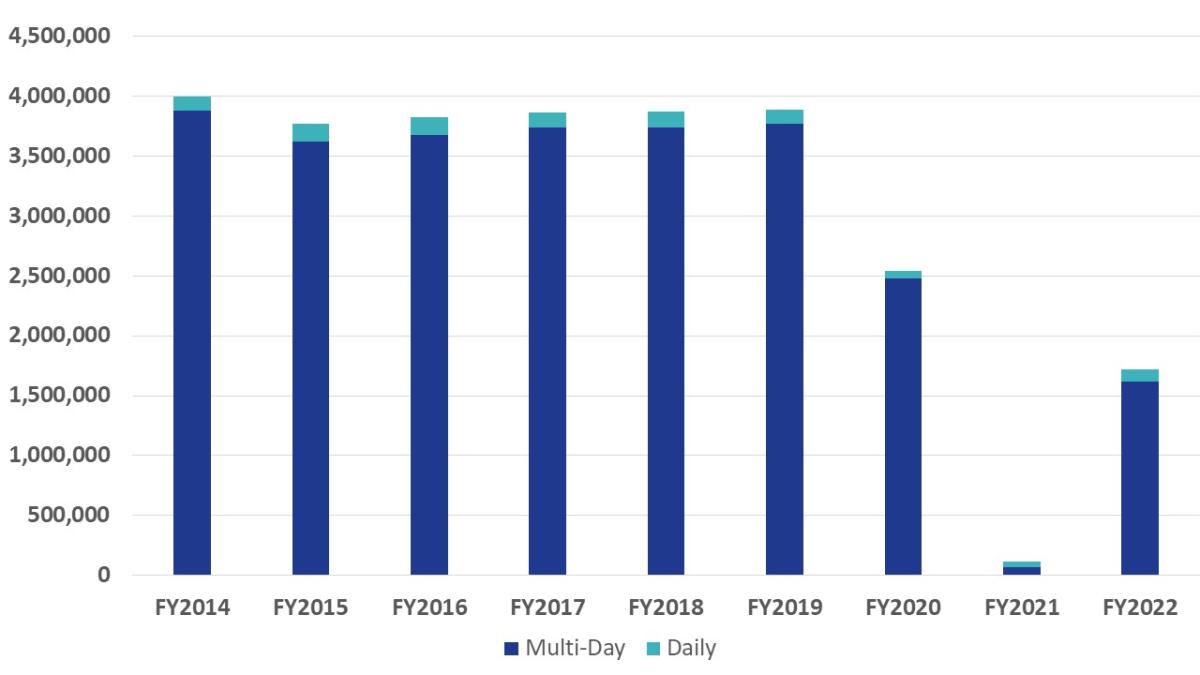
FY2022 Historical Cruise Passenger Activity
Fiscal Years 2014 - 2022
Source: Port Everglades