Energy Facts & Statistics
Annual Energy Throughput
| FY2022 | FY2021 | FY2020 | FY2019 | FY2018 | FY2017 | FY2016 | |
| Barrels | 126,502,464 | 113,045,814 | 106,919,139 | 125,874,463 | 123,404,236 | 122,307,652 | 122,68,234 |
| Total Tons | 17,861,154 | 15,950,483 | 15,147,573 | 17,769,697 |
17,433,963 |
17,260,304 | 17,095,585 |
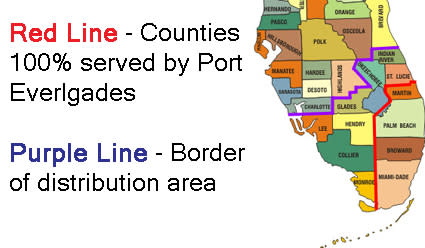
Florida Counties Served by Energy Products
Moving through Port Everglades
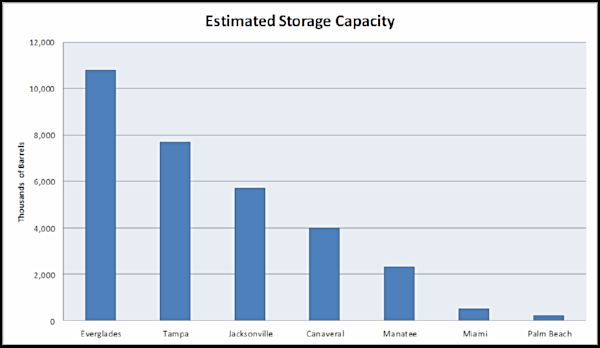
Petroleum Storage Capacity
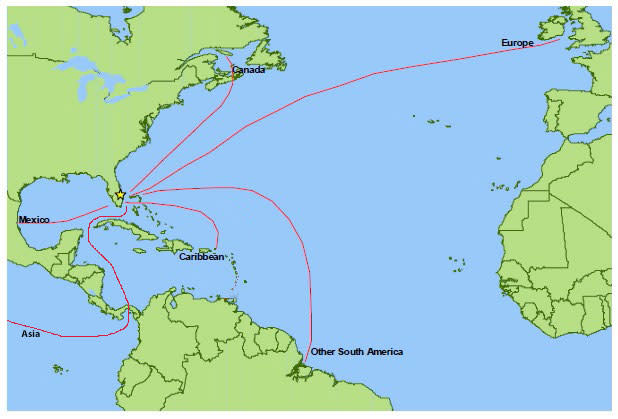
Petroleum Countries of Origin
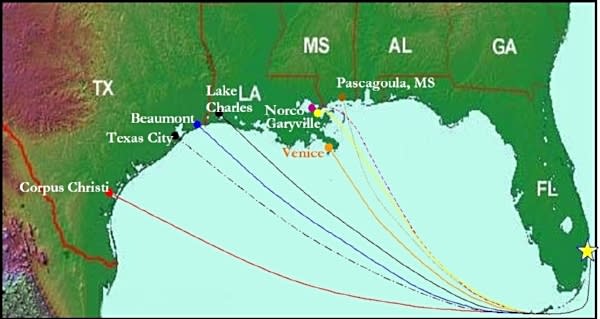
Gulf Coast Supply Origins