Energy Statistics
Annual Energy Throughput
| FY2025* | FY2024 | FY2023 | FY2022 | FY2021 | FY2020 | |
| Barrels | 131,855,196 | 129,329,097 | 129,915,243 | 126,502,464 | 113,045,814 | 106,919,139 |
| Total Tons | 18,621,222 | 18,249,648 | 18,346,928 | 17,861,154 | 15,950,483 | 15,147,573 |
(*FY2025 Preliminary Results)
Energy by Products
FY2024 vs FY2023 (Barrels)
Source: Port Everglades
| Product | FY2024 | FY2023 | % Change |
| Asphalt | 420,829 | 342,502 | 23% |
| Aviation Gasoline | 258,365 | 368,600 | -30% |
| Crude Oil Loaded | - | - | - |
| Diesel Fuel | 18,906,732 | 18,949,193 | 0% |
| Ethanol | 1,962,445 | 2,647,324 | -26% |
| Fuel Oil | 2,201,118 | 2,378,929 | -7% |
| Gasoline | 63,715,282 | 64,732,729 | -2% |
| Jet Fuel | 37,067,680 | 35,591,032 | 4% |
| Propane | 570,976 | 537,220 | 6% |
| Truck & Rail - Ethanol | 5,032,543 | 4,361,539 | 15% |
| Truck & Rail - Other | 3,108 | 6,172 | -50% |
| Total Barrels | 129,329,098 | 129,915,243 |
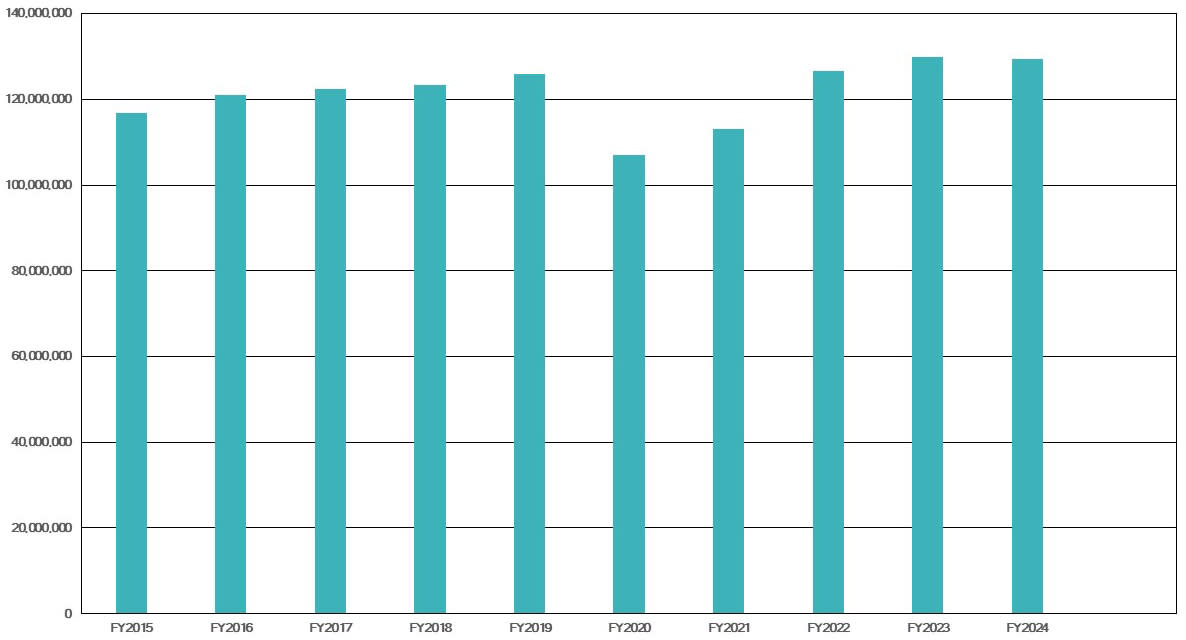
FY2024 Historical Petroleum Activity
Fiscal Years 2015 - 2024
Source: Port Everglades