Cargo Statistics

Containerized Cargo

  FY2025* FY2024 FY2023 FY2022 FY2021 FY2020  FY2019 FY2018

TEUs
(containers)

1,167,552 1,087,112 1,013,159 1,107,546 1,038,179 945,512  1,053,078  1,108,465
Total Tonnage 7,248,707 6,748,200 6,368,522 7,334,350 6,509,190 5,707,528 6,797,694 7,365,755

(*Preliminary Results for FY2025)

Florida Ports Refrigerated TEU Moves
(FY2024)


 Port Everglades

126,392

 Jacksonville

 111,187

 Miami

105,881

 West Palm Beach

 42,810

 Manatee

38,864

 Tampa

 10,598

 Panama City

 3,395

Top 10 U.S. Refrigerated Ports - TEU Moves (FY2024)


 New York, NY

325,461

 Philadelphia, PA

304,811

 Los Angeles, CA

288,029

 Wilmington, DE

183,212

Oakland, CA

164,974

 Savannah, GA 

140,572

 Long Beach, CA 

139,021

 Port Everglades, FL

126,392

 Hueneme, CA

 121,201

 Jacksonville, FL

 111,187

Bulk And Break Bulk (Tons)

 
FY2025* FY2024 FY2023 FY2022 FY2021 FY2020 FY2019
TOTAL BULK & BREAK BULK 1,841,786 1,887,219 2,020,795 2,155,616 1,882,890 1,413,275 1,840,024

(*Preliminary Results for FY2025 )

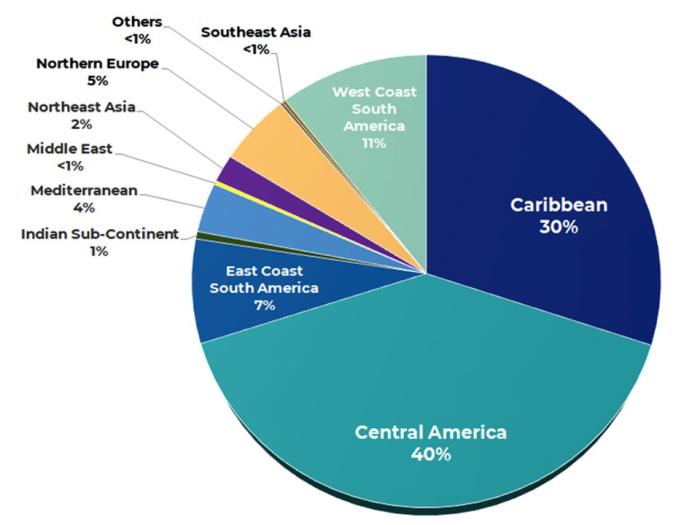
FY2024 Containerized Cargo by Tradelane
Source: Port Everglades

Pie chart of Tradelanes for FY2024

FY2024 Containerized Cargo Performance in Key Markets 
In TEUs

Source: PIERS

Total Traffic TEUs               
Trade Lane Port Everglades W Palm Beach  Jaxport  Miami  Charleston  Savannah  Total 
Caribbean 189,787 166,578 26,320 127,458 15,714 47,178 572,945
Central America 252,095 1,813 33,657 172,984 60,519 103,162 624,229
E. Coast South America 46,849 4 38,447 1,436 59,826 35,228 181,790
Indian Sub-Continent   3,360 - 11,898 15,303 146,972 355,757 533,290
Mediterranean 22,431 0 1,816 124,896 86,867 387,735 623,744
Middle East 1,756 - 2,849 4,251 37,410 180,072 226,338
Northern Europe 32,564 2 14,835 38,509 354,754 334,194 876,859
Northeast Asia 12,487 - 69,974 149,438 611,614 1,717,814 2,561,327
Others 1,249 10,429 518,988 2,099 38,198 66,733 637,695
Southeast Asia 1,460 0 77,755 65,808 306,369 616,703 1,061,094
W. Coast South America 66,879 156 863 71,840 50,306 68,837 258,882
Grand total 630,918 178,981 790,311 774,021 1,807,550 3,6913,413 8,158,195
% of TOTAL CARGO 8% 2% 10% 9% 23% 48% 100%*

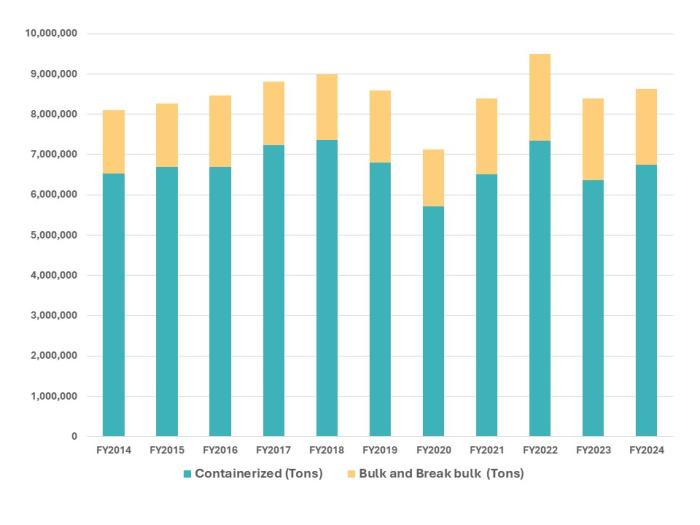
FY2024 Historical Cargo Tonnage Activity
Containerized, Bulk, Break Bulk
Fiscal Years 2015 - 2024 
Source: Port Everglades

Bar Graph Showing Historical Cargo FY2025